Understanding Data-Backed Budgeting
Data-backed budgeting is not just a trend—it’s a shift in how organizations and individuals make financial decisions. At its core, it means using real, quantifiable data to inform every step of the budgeting process. Gone are the days of relying solely on gut feeling or historical estimates; today, accessible tools and analytics allow decision-makers to forecast, allocate, and adjust budgets with precision. This method reduces waste, improves transparency, and supports strategic growth. But to reap its benefits, one must understand both the methodology and the numbers behind it.
Step 1: Identify Reliable Data Sources
The first step in data-backed budgeting is sourcing accurate, relevant data. This could include internal financial reports, sales performance, customer acquisition costs, or external economic indicators. For example, a retail company might use point-of-sale transaction data from the last 12 months to forecast seasonal demand. It’s critical to ensure the data is clean, up-to-date, and representative of actual performance. Start with what you have—accounting software, CRM systems, or even spreadsheets—and work toward integrating these sources into a unified dashboard.
Step 2: Set Objectives Before Numbers
Budgeting should be aligned with strategic goals. Whether your aim is cost reduction, revenue growth, or operational efficiency, your budget must reflect these priorities. A common mistake is jumping into number-crunching before defining objectives. For instance, a tech startup aiming to expand into new markets should allocate more resources to marketing and hiring, not just copy last year’s budget. Clear goals help you prioritize spending based on expected return, not tradition.
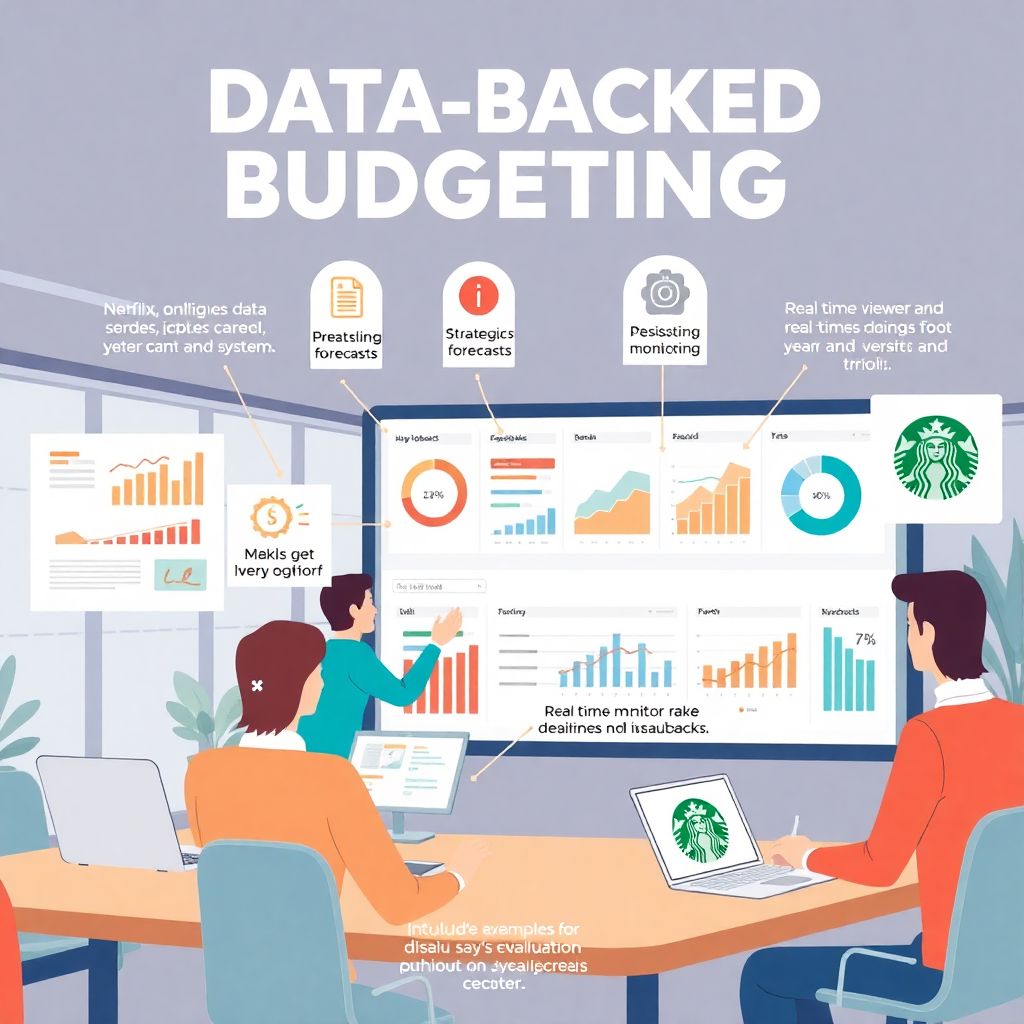
Case Study: Netflix and Content Investment
A real-world example of data-backed budgeting in action is Netflix. The company uses massive amounts of viewer data to determine which types of content to invest in. By analyzing viewing habits, completion rates, and genre preferences, Netflix allocates billions into original programming with high predicted engagement. The result? Blockbuster series like “Stranger Things” and “The Crown” that retain subscribers and drive growth. Their budget is not arbitrary—it’s an algorithmic response to user behavior.
Step 3: Create Dynamic Forecasts
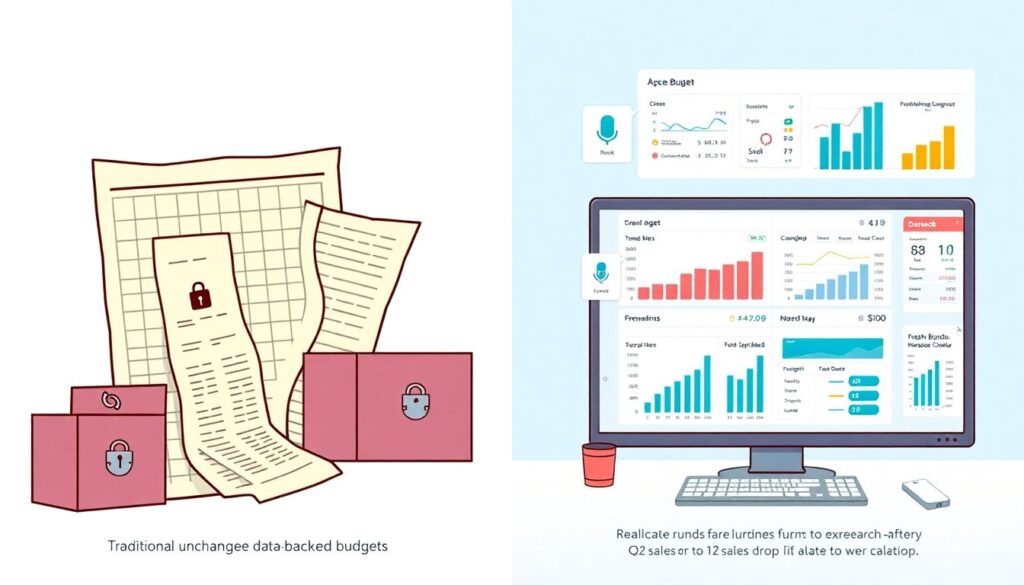
Traditional budgets are static—they don’t adapt to change. Data-backed budgets, in contrast, are dynamic. This means updating forecasts monthly or quarterly based on actual performance. For example, if sales drop unexpectedly in Q2, a dynamic budget allows you to reallocate funds from expansion to retention strategies. Use tools like scenario modeling to simulate best-case and worst-case financial outcomes. This helps you stay agile and prepared for uncertainty.
Common Pitfall: Data Overload

One of the biggest traps is drowning in too much data. When every metric seems important, decision paralysis can set in. Avoid this by focusing on key performance indicators (KPIs) that directly impact your objectives. For a SaaS business, this might mean customer churn rate and monthly recurring revenue. For a nonprofit, donor retention and program impact per dollar spent. Always ask: Does this data help me make a better decision?
Step 4: Involve Stakeholders Early
Budgeting shouldn’t be confined to the finance department. Involving team leads and department heads early in the process ensures the budget reflects operational realities. For instance, a marketing manager may have insight into upcoming campaign costs that finance may overlook. Collaborative budgeting, supported by shared data dashboards, builds accountability and helps prevent friction during execution. Transparency in assumptions and numbers fosters trust.
Case Study: Starbucks and Location Strategy
Starbucks uses data-backed budgeting to decide where to open new stores. By analyzing foot traffic, demographic trends, and competitor locations, they identify profitable sites with high accuracy. This data-driven approach minimizes the risk of underperforming locations and maximizes return on investment. It’s not just about having the data—it’s about applying it systematically to budgeting decisions.
Step 5: Monitor and Adjust in Real-Time
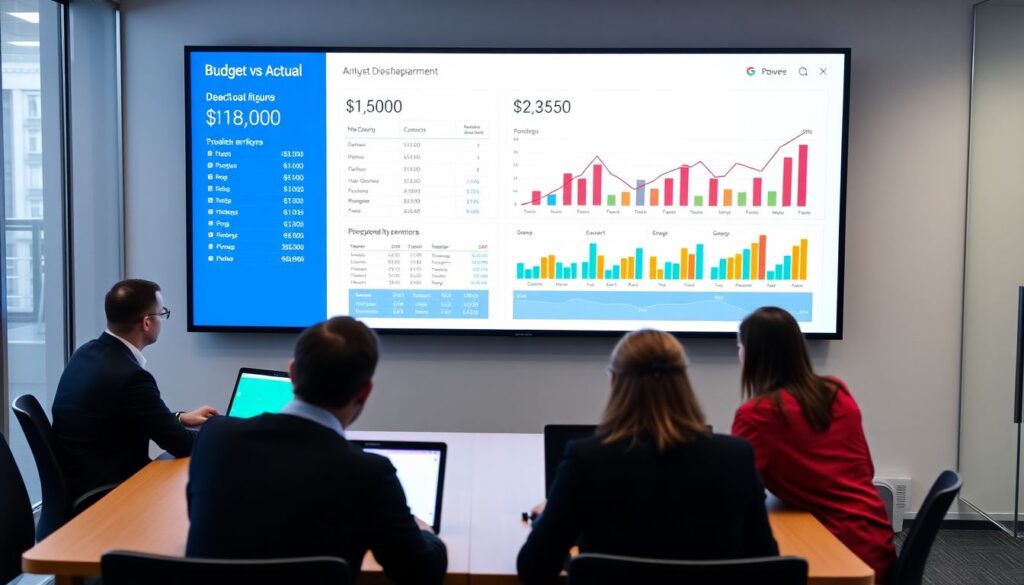
The final step is to track actuals versus budgeted figures continuously. Dashboards and visualization tools like Power BI or Google Data Studio make this easy. Set thresholds for alerts—if a department exceeds its budget by 10%, trigger a review. This real-time visibility allows for immediate course correction rather than waiting until the end of the fiscal year. Think of your budget as a living document, not a one-time plan.
Advice for Beginners: Start Small, Scale Smart
If you’re new to data-backed budgeting, don’t try to overhaul everything at once. Begin with one department or project. Use a simple spreadsheet to track actuals against estimates and learn from the variance. Over time, integrate more sophisticated tools and datasets. Remember, the goal isn’t perfection but continuous improvement. As your confidence grows, so will the accuracy and strategic value of your budget.
Final Thoughts: Let Data Drive, Not Dictate
Data-backed budgeting empowers smarter financial decisions, but it shouldn’t strip away human judgment. Context, intuition, and experience still matter—especially when interpreting ambiguous trends or disruptive events. The real power lies in the synergy between data and decision-making. When used thoughtfully, data becomes a compass, not a cage, guiding your budget toward measurable success.