Why “Just Fix It When It Breaks” Is an Expensive Myth
When people hear “maintenance”, most imagine a technician showing up after something has already failed.
That’s the old, reactive mindset — and it’s still surprisingly common, from small home maintenance services to large industrial maintenance services.
But if you look at the numbers, waiting for breakdowns is one of the most expensive ways to run any asset: a building, a factory line, even a small office.
Let’s unpack different approaches to maintenance in a down-to-earth way, compare them, and see where each actually makes sense.
—
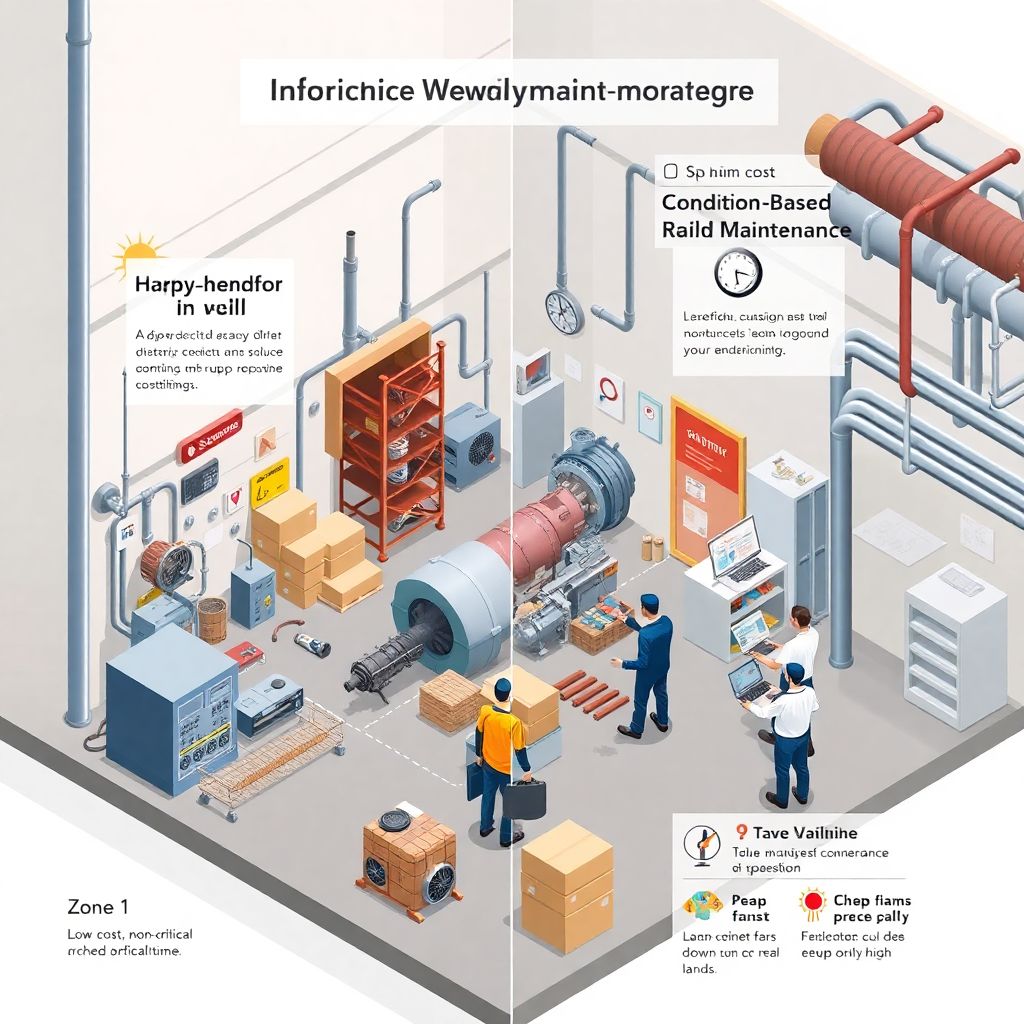
Four Core Approaches to Maintenance (And Where They Work)
1. Run-to-Failure: “We’ll Fix It When It Dies”
This is the simplest — and riskiest — approach. You use equipment or infrastructure until something breaks, then call maintenance services to patch it up.
Sounds irresponsible? Not always.
In practice, run-to-failure is rational only when:
– The asset is cheap
– Failure is safe (no injuries, no big financial loss)
– Downtime is acceptable
Think: a low-cost office fan, a basic desk lamp, a simple garden pump at home.
In a residential context, some home maintenance services even recommend this tactic for inexpensive, non-critical items where inspection costs would exceed replacement costs.
But the minute you apply this approach to:
– A server hosting your online store
– The only elevator in a 15-floor building
– A key motor on a production line
…the economics change dramatically.
A manufacturer I worked with had a habit of “running conveyors until they squeal.” One broken gearbox stopped a full packaging line for 11 hours. The gear itself cost $600. The lost production and emergency labor? Just over $28,000 for that single incident.
Run-to-failure isn’t evil. It’s just a tool that should be used only for low-risk assets. Most organizations apply it way beyond that boundary.
—
2. Time-Based Preventive Maintenance: The “Car Service” Model
Time-based preventive maintenance services are what most people intuitively understand: inspect or replace parts at set intervals — every 3 months, every 10,000 km, every 2,000 hours of operation.
This is the “change your oil every 10,000 km” mindset.
It’s widely used in:
– Building maintenance services
Seasonal roof inspections, annual HVAC checkups, elevator certifications, fire system tests.
– Industrial maintenance services
Scheduled shutdowns for cleaning, lubrication, alignment, and pre-emptive replacement of wear parts.
– Home maintenance services
Annual boiler checks, cleaning chimney flues, servicing heat pumps.
Time-based plans usually cut failures dramatically compared to pure run-to-failure. According to multiple reliability studies, a basic preventive program can reduce unplanned downtime by 30–50% in the first year.
But there’s a trade-off: you often over-maintain.
You’re replacing parts that could run safely for another 20–40% of their life, just because the calendar or hour-meter says it’s time. In one food processing plant, switching to smarter strategies reduced spare-parts consumption by 17% without increasing failures.
Time-based preventive maintenance is a strong baseline. It’s easy to explain, easy to schedule, and good enough for many assets. The question now is how to go beyond it when stakes are higher.
—
3. Condition-Based Maintenance: “Fix It When It Starts Acting Weird”
Condition-based maintenance (CBM) flips the logic.
Instead of “every 6 months,” it says: “Only intervene when the asset starts showing signs of degradation.”
You monitor actual condition, not just time.
Typical condition signals:
– Vibration patterns on motors and pumps
– Temperature of bearings, windings, or electronics
– Oil quality, metal particles in lubricants
– Pressure, flow, or current anomalies
You only perform maintenance when indicators cross defined thresholds.
This approach is increasingly common in:
– High-value industrial maintenance services for turbines, compressors, CNC machines
– Critical building systems such as chillers and data center cooling
– Expensive residential equipment like ground-source heat pumps in premium home maintenance services
Real example:
A mid-sized plastics plant introduced vibration monitoring on 42 critical motors and gearboxes. Before CBM:
– They had ~12 unexpected failures per year
– Average downtime per failure: 6 hours
After one year of condition-based maintenance:
– Unexpected failures dropped to 3 per year
– Average downtime fell to 1.5 hours
– They caught 9 “would-have-been” failures in advance and scheduled repairs on weekends
The key insight: CBM is most cost-effective for:
1. High-value assets
2. Where failure has high impact
3. Where degradation leaves detectable traces
It’s not worth wiring up every bathroom fan with sensors. But for that chiller on the roof that cools the entire data center? It’s usually a no-brainer.
—
4. Predictive Maintenance: “Let the Data Tell You When It’ll Fail”
Predictive maintenance (PdM) is like CBM with advanced analytics.
You don’t just react when a threshold is crossed. You analyze:
– Historical failure patterns
– Live sensor data
– Operating context (load, temperature, duty cycles)
…to estimate remaining useful life (RUL) of components and schedule intervention at the optimal moment.
In practice, this can involve:
– Machine learning models
– Statistical survival analysis
– Pattern recognition on sensor streams
A power generation company applied PdM to gas turbines:
– Before: scheduled major overhauls at fixed intervals
– After: dynamically adjusting overhaul timing based on degradation data
Result: They extended overhaul intervals on some units by 12–18% without increasing risk, saving several hundred thousand dollars per turbine over a 5-year cycle.
But PdM isn’t a free upgrade:
– You need good data quality and enough history
– You must manage model drift and false alarms
– You need engineers who understand both the equipment and the algorithms
For many organizations, the smart sequence is:
1. Start with disciplined preventive maintenance services
2. Add condition-based monitoring on critical assets
3. Introduce predictive models where data volume and business impact justify it
—
Technical Deep Dive: What Actually Fails and Why
Failure Patterns Most People Misunderstand
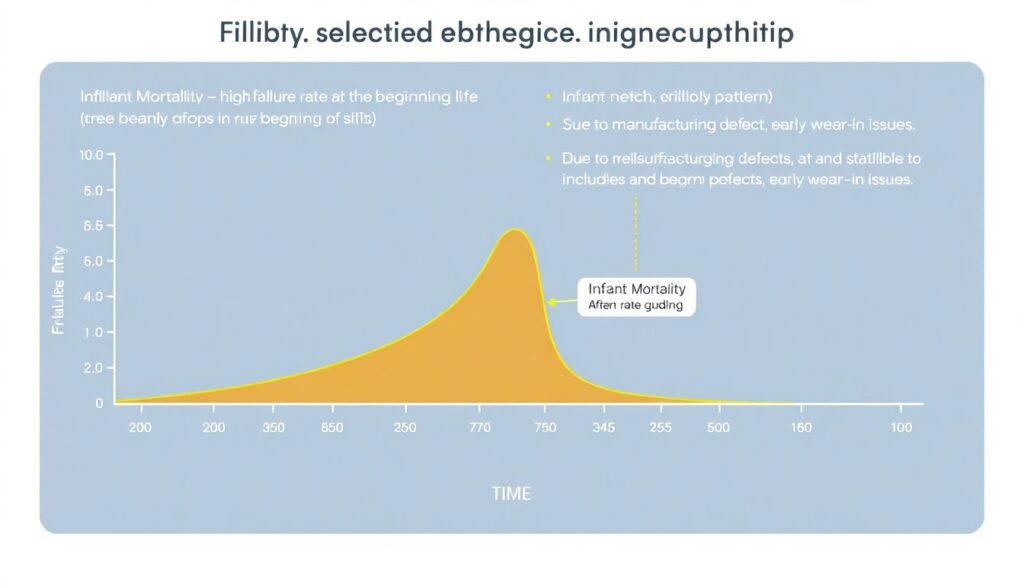
Many still assume that “older equipment fails more often.” Reality is more nuanced.
Reliability engineering studies (like the classic work by Nowlan & Heap, still relevant) show several common patterns:
1. Infant Mortality: High failure rate early in life, then stabilizing
Often due to manufacturing defects or installation errors.
2. Random Failure: Roughly constant failure probability over time
Caused by external events, misuse, or design weaknesses.
3. Wear-Out: Failure probability increases with age
Typical for mechanical wear parts like bearings and seals.
Most calendar-based preventive schedules implicitly assume a wear-out pattern. But in practice, more than half of industrial components fail in either infant mortality or random mode. That means fixed-interval replacement often doesn’t align with actual risk.
Technical Block: A Simple Condition Monitoring Scheme
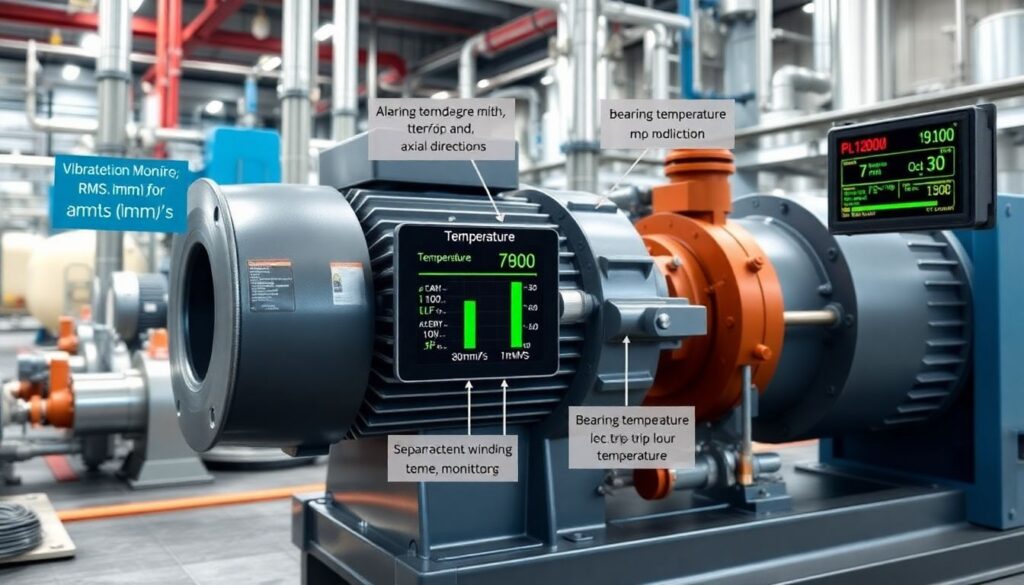
Imagine a critical pump motor in a chemical plant.
You might monitor:
– Vibration:
– RMS velocity (mm/s) in horizontal, vertical, axial directions
– Alarm at 7 mm/s, trip at 10 mm/s (ISO 10816 ballpark for certain machines)
– Temperature:
– Bearing temp: alarm at 90°C, trip at 100°C
– Winding temp differential vs ambient
– Electrical:
– Current imbalance between phases
– Total harmonic distortion
If vibration slowly trends from 3 to 6 mm/s over 2 months, with rising bearing temperature and metal particles in oil, you don’t wait. You plan a bearing replacement in the next outage window.
This is condition-based maintenance, and with enough history you can estimate failure likelihood in the next N operating hours — a step toward predictive.
—
Comparing Approaches: Where Each One Makes Sense
Let’s compare the main approaches not philosophically, but by where they realistically belong.
1. Run-to-Failure
– Best for: low-cost, non-critical assets with minimal downtime impact
– Example: small office fans, inexpensive lighting fixtures in non-critical areas
– Main risk: people “accidentally” use it for critical assets because it’s convenient
2. Time-Based Preventive Maintenance
– Best for: assets with known wear patterns and clear regulatory or safety requirements
– Example: elevators (mandatory inspections), fire suppression systems, vehicle fleets
– Main benefit: simple to manage, predictable workloads
– Main risk: over-maintenance and missed failures that don’t follow the textbook pattern
3. Condition-Based Maintenance
– Best for: medium-to-high criticality assets where degradation is measurable
– Example: chillers, pumps, compressors, CNC spindles
– Main benefit: fewer unnecessary interventions, fewer surprises
– Main challenge: designing the right monitoring strategy and thresholds
4. Predictive Maintenance
– Best for: high-value, data-rich environments where downtime is extremely expensive
– Example: turbines, large production lines, 24/7 logistics hubs
– Main benefit: optimized asset life and minimal unplanned downtime
– Main challenge: data quality, analytics expertise, organizational maturity
—
Real-World Scenarios: How Choices Play Out
Scenario 1: Office Building vs. Logistics Warehouse
In a standard office building:
– Building maintenance services often rely on time-based plans:
– Quarterly HVAC inspections
– Annual elevator maintenance
– Scheduled checks for fire systems and emergency lighting
Condition-based monitoring might be limited to:
– Chiller performance
– Energy consumption patterns
In a high-throughput logistics warehouse:
– Conveyor breakdown during peak season can cost tens of thousands per hour.
– Here, you’ll see:
– Condition sensors on motors and rollers
– Real-time monitoring of power draw and jam frequency
– Analytics predicting weak points before Black Friday or seasonal peaks
Same general asset families (HVAC, conveyors, controls), but the business risk profile drives a completely different maintenance strategy.
—
Scenario 2: Residential Complex vs. Chemical Plant
In a residential complex:
– Home maintenance services focus on:
– Boiler and heat pump checkups
– Plumbing and leak detection
– Periodic inspection of roof and facade
Here, structured preventive plans with seasonal checklists give 80–90% of the benefit.
Adding heavy-duty sensors to every pump and fan is usually overkill.
In a chemical plant:
– Loss of containment (leaks) can be catastrophic.
– Critical rotating equipment gets:
– Continuous condition monitoring
– Detailed failure modes and effects analysis (FMEA)
– Sometimes twin assets (N+1 redundancy) plus predictive models
The technology you apply must match both the technical and the business risk.
—
How to Choose the Right Mix for Your Context
There’s no one-size-fits-all recipe, but an analytical approach helps.
1. Map Your Assets by Criticality
– Ask: If this fails, what happens?
– Consider safety, environment, downtime cost, and customer impact.
2. Understand Failure Modes
– Do components mostly wear out predictably?
– Or do they fail randomly or due to external conditions?
3. Start with Solid Preventive Maintenance Services
– Get basic schedules, checklists, and record-keeping under control.
– Sloppy execution here will sink any fancy predictive efforts later.
4. Add Condition Monitoring Where It Pays
– Focus on the top 10–20% most critical assets.
– Start simple: manual vibration readings or temperature logs before installing full online systems.
5. Evaluate Predictive Analytics Gradually
– Pilot on one line, one building, or one asset family.
– Compare real downtime, cost, and false alarms vs. your existing process.
—
Technical Block: Metrics That Actually Matter
If you want to be serious about maintenance strategy — whether it’s building maintenance services or heavy industrial assets — focus on a core set of metrics:
– MTBF (Mean Time Between Failures)
How often failures occur. Good for tracking improvement over time.
– MTTR (Mean Time To Repair)
How long it takes to fix things. Lower MTTR often correlates with better planning and spares management.
– Planned vs. Unplanned Work Ratio
A mature operation aims for 70–80% planned work.
If most of your work is reactive, you’re paying a hidden tax in overtime, express shipping, and chaos.
– Maintenance Cost as % of Asset Replacement Value (ARV)
For many industries, a healthy benchmark is 2–4% of ARV per year.
Much lower can signal under-maintenance; much higher may indicate inefficiency or aging assets.
These indicators give you a hard, numeric way to compare strategies — not just rely on gut feeling.
—
Final Thoughts: Maintenance as a Business Decision, Not a Checkbox

Maintenance isn’t just about keeping machines spinning or lights on.
It’s about shaping how predictable, safe, and profitable your operations are.
– Run-to-failure can work in specific, low-risk niches.
– Time-based preventive maintenance is a strong foundation.
– Condition-based and predictive strategies unlock serious savings and reliability for critical assets.
The most effective organizations don’t chase buzzwords. They match the level of sophistication in their maintenance services to the actual risk and value of their assets.
If there’s one practical takeaway:
Stop thinking “maintenance = cost center.”
Start asking, for each major asset: “What is the cheapest way to avoid nasty surprises here?”
Your answer to that question — not trends, not vendor pitches — should drive which maintenance approach you choose.